Crop protection is essential to ensure abundant, high-quality yields. An effective plant protection strategy must be rooted in close observation of the crop and supported by data that accelerate decision-making, enabling a prompt response to the needs arising during the growing season.
Precision agriculture and the use of DSS (Decision Support Systems) naturally fit into this virtuous process by organising the wealth of information available to advisors and farmers and providing a sound basis for timely, agronomically valid decisions.

The development of integrated pest management
The current approach to crop protection, based on integrated and sustainable production management, is the result of a long process that began in the early 1970s. During that period, the primary sector moved towards a more informed and rational use of chemical inputs through guided pest management.
The common thread throughout this evolution was the search for the best possible balance in managing damage caused by harmful organisms. This meant considering not only the immediate economic cost of control measures, but also their toxicological, environmental and social costs, in order to assess the actual cost-effectiveness of plant protection interventions. This laid the foundations for integrated pest management, marking a shift from fixed, calendar-based treatments to interventions carried out only when genuinely needed.

Comparison between scheduled interventions and assessments based on the actual needs of the crop (Illustration created with the support of artificial intelligence and subjected to editorial review)
From the 1990s onwards, developments in EU legislation recognised integrated pest management as a best practice, linking it to financial support and establishing common criteria, production standards, intervention thresholds and restrictions on the use of plant protection products.
Subsequently, Directive 2009/128/EC made integrated pest management compulsory for all farms in the European Union. Under this approach, crop protection is not based solely on the choice of a plant protection product, but on a set of general principles:
- using agronomic practices as the first line of prevention: crop rotation, varietal selection, soil management and the protection of beneficial organisms
- monitoring harmful organisms in the field to select the appropriate crop protection strategy
- using scientifically sound intervention thresholds
- giving priority to biological, biotechnological, physical or agronomic methods whenever available
- selecting plant protection products with the lowest possible impact on human health and beneficial organisms
- reducing the number of treatments
- implementing anti-resistance strategies
 Within this framework, integrated pest management is not merely a set of constraints. It is a management method that requires knowledge, data, technical support and decision-making tools capable of helping farmers and advisors intervene only when necessary and in the most appropriate way.
The reduction and evolution of the plant protection product portfolio
In response to the growing focus on environmental sustainability, the past twenty years have seen a significant change in the plant protection product portfolio. Numerous studies show how the number and types of active substances authorised in Europe have evolved. A study by P. A. Marchand (2023) highlights the following trend:
-
- with the entry into force of Regulation (EC) No 1107/2009, many long-established substances were removed
- the 342 active substances initially included in Annex I to Directive 91/414/EEC fell to 298 under Regulation (EU) No 540/2011
- between 2011 and 2018, the total number of approved substances increased to approximately 502, mainly due to the introduction of:
- microorganisms,
- biocontrol substances,
- low-risk substances;
-
- from 2018 onwards, the total began to decline again because very few new chemical substances were approved, while withdrawals and non-renewals continued. Overall, between 2018 and 2022, 53 active substances were lost
Similarly, the European Commission reports several noteworthy figures on the evolution of authorised active substances:
- 25 years ago, approximately 1,000 active substances were available on the European market
- today, approximately 500 remain
- approximately 25% of the substances currently authorised are:
- microorganisms,
- pheromones,
- plant extracts,
- other substances considered to be low risk.

Over 25 years, the number of active substances available on the market has almost halved, while their characteristics have also changed. The evolution of the product portfolio, with biological and low-risk solutions playing an increasingly important role, requires more accurate agronomic management and greater integration with decision support tools. These tools help identify the optimal timing for intervention and maximise the effectiveness of the products available.
How Decision Support Systems fit into integrated pest management
Decision Support Systems (DSS) provide a response to the technical and regulatory complexity faced by agriculture today, providing a concise farm-level overview of the main issues and risks that require action.
A DSS consists of several tools that can be grouped into three main areas:
- monitoring tools: the set of field information observed by the farmer or advisor, or measured by sensors and other technologies, such as weather stations, satellite data, drones and soil analyses
- forecasting tools: algorithms that process the available data and estimate the risk of disease infection and pest development, as well as water and nutrient stress
- decision-making and prescription tools: tools that organise the information processed by the DSS and provide decision-makers with a concise, representative overview of conditions across the farm.


When combined with technical expertise and knowledge of the farm, Decision Support Systems offer farmers and advisors a range of benefits:
- timely decisions, thanks to models that forecast the development of major biotic and abiotic stresses, helping to avoid prolonged stress or delayed interventions
- rapid assessment of crop health, low-vigour areas and the effectiveness of completed operations, using vegetation indices derived from satellite imagery
- fast, automated analysis of available data, helping users manage more fields and farms while improving operational efficiency
- the definition of agronomically appropriate strategies focused on profitability, product quality and a lower environmental impact
Innovation and accessibility with the Agricolus DSS
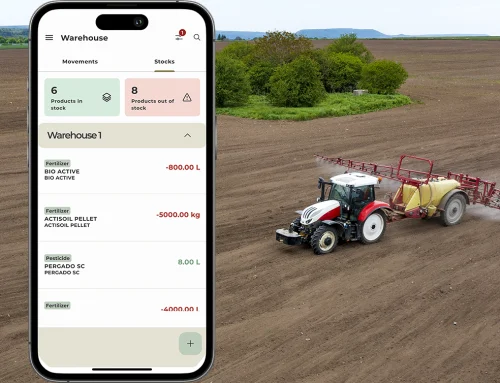
The adoption of innovative agronomic management systems still faces a major barrier: accessibility. Tools must be simple and intuitive. Agricolus has been working to address this challenge for years by offering an easy-to-use platform and personalised technical support that equips users with the necessary skills. The smartphone app also brings the DSS directly into the field, making it easier to enter information and view agronomic recommendations.


Use cases
Through collaboration between our technical and sales network and the Research and Development team, Agricolus invests in validation activities and field testing of predictive models and innovative practices. This has enabled us to develop tools tailored to farm needs and designed to support optimal crop protection management.
Vineyard crop protection: the grapevine downy mildew model
The Agricolus grapevine downy mildew model describes the infection cycle of Plasmopara viticola using rainfall, temperature, humidity and leaf wetness data measured in the field by weather stations. It estimates when the pathogen may cause primary and secondary infections.
An important feature of the downy mildew model is that it accounts for oospore maturation. Oospores are the structures through which the pathogen survives the winter in leaf debris and are the main source of inoculum for primary infections in spring.
After the first infections, the model also tracks the development of secondary infections, which are linked to sporulation on existing lesions and the subsequent spread of the pathogen under favourable conditions. Finally, it provides information on disease incubation, making it possible to forecast when symptoms will appear following infection.

Figure 1 – Graph from the Agricolus platform: The pink lines indicate the periods in which the vine was covered by treatment; the red lines represent the incubation period of primary infections, the yellow lines the incubation period of secondary infections.

Figure 2 - Graph of the Agricolus platform: model assuming no treatments have been included.
From an operational perspective, the model interacts with recorded treatments, resetting the infection risk when a treatment has been entered. It also provides an infection forecast of up to seven days, supporting the use of protectant rather than curative products.

Life cycle of Downy Mildew - source: Caffi et al., 2021
When combined with technical expertise and field observations, the Agricolus downy mildew model:
- helps avoid unnecessary treatments by supporting the technical assessment made in the field
- reduces the environmental impact of crop protection by supporting the use of protectant products
- helps target field monitoring by indicating when symptoms are expected to appear
- supports the appropriate timing of crop protection measures by simulating pathogen development in detail
Olive crop protection: predictive models for the olive fruit fly
For olive crops, Agricolus supports crop protection management by integrating two predictive models specifically developed for Bactrocera oleae. The first describes the development of successive generations of the insect, driven by hourly mean temperatures. The second estimates population mortality as a function of high temperatures, which are a limiting factor for adults by reducing fertility and survival, and for eggs and larvae inside drupes that are more exposed to solar radiation.
In a field trial conducted in Tuscany in 2025, we observed that using the predictive models enabled a significant reduction in adulticide treatments.
Figures 1 and 2 show the olive fruit fly development and mortality models.

Fig. 1 - Graph from the Agricolus platform: olive fruit fly development model showing adult presence curves for the first and second generations. The pink bands indicate the coverage period of the four treatments entered by the user.

Fig. 2 - Graph from the Agricolus platform: Bactrocera oleae mortality model. The orange line indicates daily mortality, the red line indicates cumulative weekly mortality. The peak daily mortality in the first half of August reflects the very high summer temperature trend, which severely limited the survival of first-generation adults during that period. Exploiting unfavorable thermal conditions for the insect as a containment factor, complementary to insecticide treatments, represents a sustainable strategy from both an environmental and economic standpoint.
The insect appears to have completed three generations during the season, with the first-generation adult peak occurring around 20 August and the second-generation peak between 17 and 19 September.
This information guided the planning of adulticide treatments, enabling applications during the periods when the insect was most vulnerable and distributing the treatments to ensure continuous protection throughout the most critical flight phases. This is particularly evident for the second generation in Figure 1 and the first generation in Figure 2.
In early August, after observing the development of juvenile stages and low mortality, the user chose to apply an adulticide treatment to target the first newly emerged adults. During the emergence peak, high mortality kept the population under control, and the user therefore considered a further insecticide treatment unnecessary.
 In early August, after observing the development of juvenile stages and low mortality, the user chose to apply an adulticide treatment to target the first newly emerged adults. During the emergence peak, high mortality kept the population under control, and the user therefore considered a further insecticide treatment unnecessary.

For the second generation, by contrast, treatments were timed to cover the entire period of adult presence, also because mortality was lower under the cooler temperatures.
Thanks to predictive models that combine agrometeorological data, olive phenology and pest population dynamics, the farmer was able to time adulticide treatments for the period of maximum effectiveness, ensuring continuous protection during the most critical flight phases. The number of treatments – four – was therefore considerably lower than the eight permitted under the integrated production standard.
Conclusions
Precision agriculture and the use of Decision Support Systems can facilitate the transition towards more sustainable and profitable farming, while complying with the regulations governing mandatory integrated pest management.
A thorough understanding of the development dynamics of the main pathogens, combined with the processing of the large volumes of data now available, makes it possible to reduce the number of crop protection interventions, optimise costs and maximise yields.