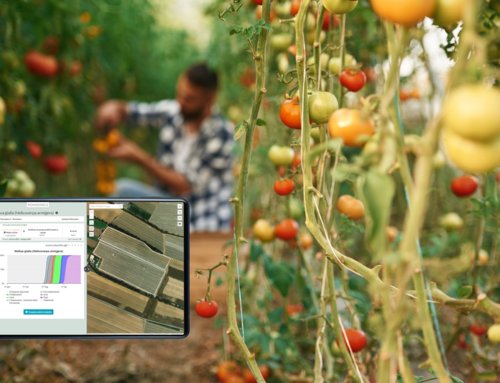
The spread of the use of satellite images in agriculture has promoted the research for new vigor indices: at present there are about one hundred.
The vigor indices are correlated, but each of them is more effective when used in specific crop conditions.
Which vigor indices can be used?
The most common index is the NDVI, but there are also others:
- NDVI (Normalized Difference Vegetation Index): is the most common vegetation index. It is calculated as the ratio between the difference and the sum of the reflectance in near infrared and in red.
- GNDVI (Green-NDVI): it is very similar to NDVI. It is calculated as the ratio between the difference and the sum of the reflectance in near infrared and green.
- SAVI (Soil-Adjusted Vegetation Index): it is similar to NDVI, but applies a correction value to reduce the effect of bare soil. It works well even with low vegetation cover, and allows to compare fields with very different soils.
- WDRVI (Wide Dynamic Range Vegetation Index): applies a correction factor to NDVI, so that it is effective even with well-developed vegetation.
- EVI (Enhanced Vegetation Index): is an index based on the reflectance of red, near infrared and blue. It is mainly sensitive to vegetative development, while it is little influenced by greenness; thanks to this index it is possible to calculate the LAI (Leaf Area Index) for some crops.
How to choose a vigor index?
These several vigor indices may be ineffective under certain conditions. In particular, NDVI and GNDVI saturate with well-developed vegetation that completely covers the soil (leaf area index >2); in this case it is better to use more saturation resistant indices, such as WDRVI.
In the initial phenological phases the vegetation is still underdeveloped because little plants have just been transplanted, or the plant is in vegetative recovery. In this case the leaf area index is low and differences in NDVI may be due to differences in soil composition: it is therefore better to use SAVI, which eliminates the effect of bare soil on the index.
The EVI is another very interesting index, more sensitive to vegetative development than to greenness. It allows to calculate the LAI index that numerically corresponds to the leaf area index (m2/m2) in maize and herbaceous crops.
In summary, it is possible to identify the vigor indices that can be used in relation to the leaf area index (LAI).
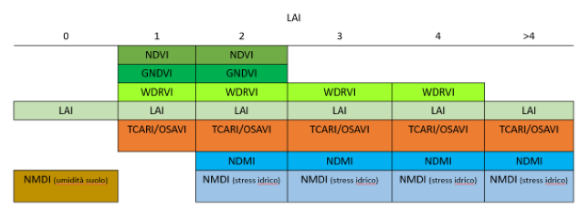
vigor indices and LAI
How to interpret vigor indices?
The values of the indices must be interpreted effectively to provide useful information to the user. Here is a brief guide:
NDVI, GNDVI, SAVI
| Value | Field condition |
|---|---|
| <0.1 | Bare soil or clouds |
| 0.1 – 0.2 | Almost absent canopy cover |
| 0.2 – 0.3 | Very low canopy cover |
| 0.3 – 0.4 | Low canopy cover with low vigour or very low canopy cover with high vigour |
| 0.4 – 0.5 | Mid-low canopy cover with low vigour or low canopy cover with high vigour |
| 0.5 – 0.6 | Average canopy cover with low vigour or mid-low canopy cover with high vigour |
| 0.6 – 0.7 | Mid-high canopy cover with low vigour or average canopy cover with high vigour |
| 0.7 – 0.8 | High canopy cover with high vigour |
| 0.8 – 0.9 | Very high canopy cover with very high vigour |
| 0.9 – 1.0 | Total canopy cover with very high vigour |
WDRVI
| Value | Field condition |
|---|---|
| -1 | Bare soil |
| 1 | Total canopy cover with very high vigour |
LAI
| Value | Field condition |
|---|---|
| 0 | Bare soil |
| 3 | Soil completely covered with vegetation |