Forecast models for agriculture
Forecast models for agriculture are digital tools that process weather, agronomic and crop data to provide useful information for crop management. In this way, they support farmers and agronomists in assessing phenology, water and nutrient requirements, and the risk associated with specific crop diseases or harmful insects.
They are valuable because they complement field experience with up-to-date information on crop development and on the factors that can affect it.
Adopting effective agronomic strategies
Growing attention to environmental sustainability, production safety and input costs has encouraged the adoption of increasingly targeted approaches. In this context, integrated crop management and innovative technologies help optimize the use of water, fertilizers and crop protection products against pests and diseases.
Modern agronomic strategies therefore aim to use inputs efficiently, identifying not only how much to apply, but also when to intervene. The objectives are multiple:
- reduce management costs
- protect crop yield and quality
- limit unnecessary interventions
- promote more sustainable agroecosystem management
Direct monitoring remains essential, as it provides up-to-date information on the presence of infestation or infection outbreaks, crop phenological stage, and nutritional or water stress. However, it can require time, specialist expertise and continuous data collection.
Integrating digital tools makes it possible to organize and process these data more quickly and turn them into useful information for agronomic decision-making.
What forecast models are and how they work
A forecast model processes a set of input data to describe or estimate the evolution of an agronomic phenomenon. Depending on its purpose, it may use weather information, crop characteristics, phenological data and field observations.
The process can be summarized in four steps:
DATA → MODEL PROCESSING → FORECAST OR INDICATOR → DECISION SUPPORT
The output does not replace the assessment of the farmer or agronomist. Instead, it provides valuable information for interpreting crop conditions and deciding whether to intervene, when to do so and to what extent.
What information can they provide?
In addition to weather forecasts, which are widely available and commonly used, forecast models developed specifically for agriculture can provide guidance on:
- phenology (crop development stage or fruit ripening stage)
- risk of infection or infestation by specific pathogens or pests during the crop cycle
- nutrient requirements
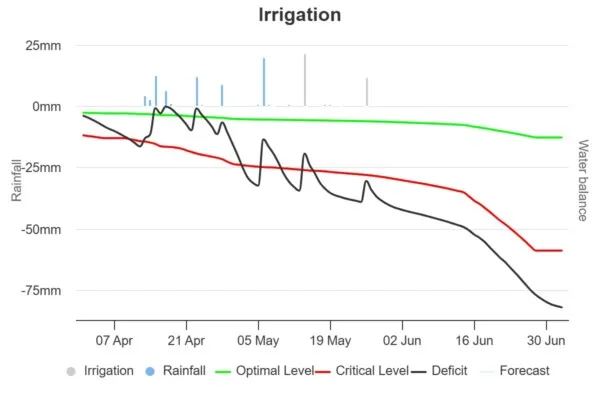
- water requirements
There is no single model that is valid for every crop or phenomenon: inputs, calculation logic and outputs vary depending on the agronomic objective.
How to use them in agronomic decision-making
The value of a forecast model emerges when its output is interpreted together with the actual conditions of the field.
For example, a crop forecast model may indicate conditions that are favorable to the development of a specific disease. The farmer or agronomist compares this alert with field observations, crop status and weather conditions in order to assess the most appropriate strategy.
The same principle applies to irrigation, nutrition and phenology: the information generated by the model becomes truly valuable when it is contextualized within the specific conditions of the farm.
Forecast models and DSS: what is the difference?
A forecast model and a Decision Support System (DSS) are related concepts, but they are not the same.
A model processes specific data to describe or predict a particular phenomenon. A DSS, on the other hand, integrates multiple information sources and tools, such as weather data, forecast models, field observations and crop information, and organizes them to support farmers in the decision-making process. Forecast models are therefore one of the components of a DSS.
A real-world example: the grapevine downy mildew crop protection model
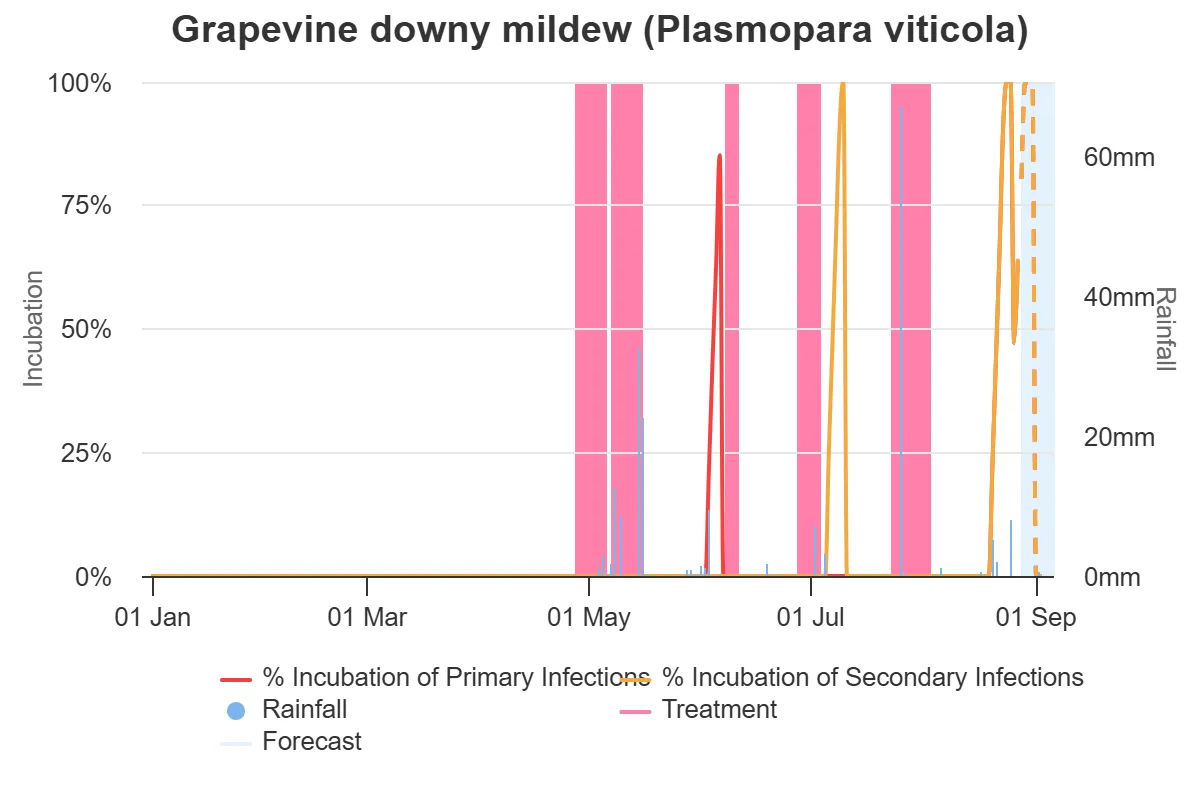
Among the crop protection forecast models developed by Agricolus for vineyards is the one dedicated to grapevine downy mildew (Plasmopara viticola). The model describes the infection cycle of the pathogen using rainfall, temperature, humidity and leaf wetness data measured in the field by weather stations.
The model processing makes it possible to estimate when the pathogen may cause primary and secondary infections. One distinctive feature is that the model takes oospore maturation into account. Oospores are the structures through which downy mildew survives the winter in leaf residues and are one of the main sources of inoculum for primary spring infections.
After the first infections, the model also tracks the development of secondary infections, which are linked to sporulation on existing lesions and the subsequent spread of the pathogen when favorable conditions occur. It also provides information on the disease incubation stage, helping to predict when symptoms may appear after infection.
Within the app, this information can be viewed together with recorded crop protection treatments. The chart makes it possible to compare disease development with the periods during which the vineyard is protected. The model output therefore supports the assessment of the crop protection strategy and should be interpreted together with field observations and the winegrower’s experience.
Forecast models available in Agricolus
With Agricolus, farmers have access to forecast models for phenology, irrigation and nutrition for all crops, as well as crop-specific forecast models for the following crops:
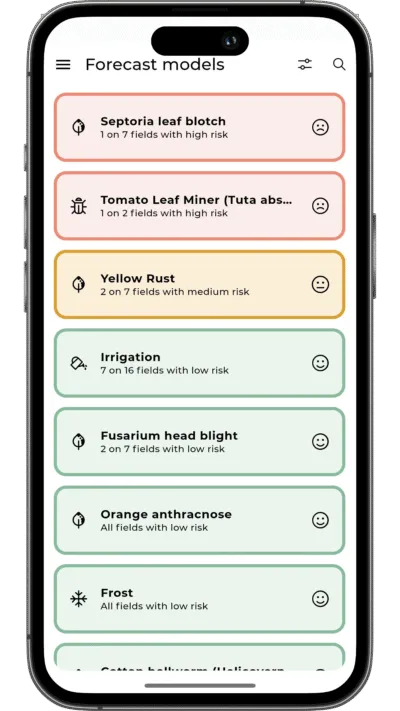
All models are based on meteorological information from field stations and adapt to different contexts through the inclusion of particular crop operations or phenological observations.