Features
Traps and Catches
App mobile
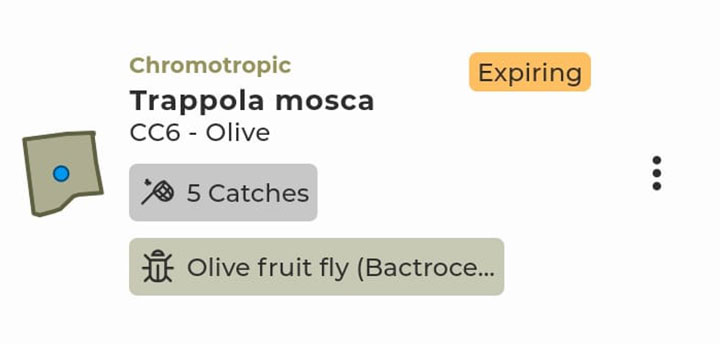
Each trap registered is displayed as an interactive card containing the following information:
- trap type
- name
- associated field and crop
- graphic representation of the field with the trap's position
- last registered expiration date (only for pheromone traps)
- "expired" or "expiring soon" tag if the expiration date has passed or is within
- days (only for pheromone traps)
- number of catches
- target species shown with specific tags
List
Trap detail
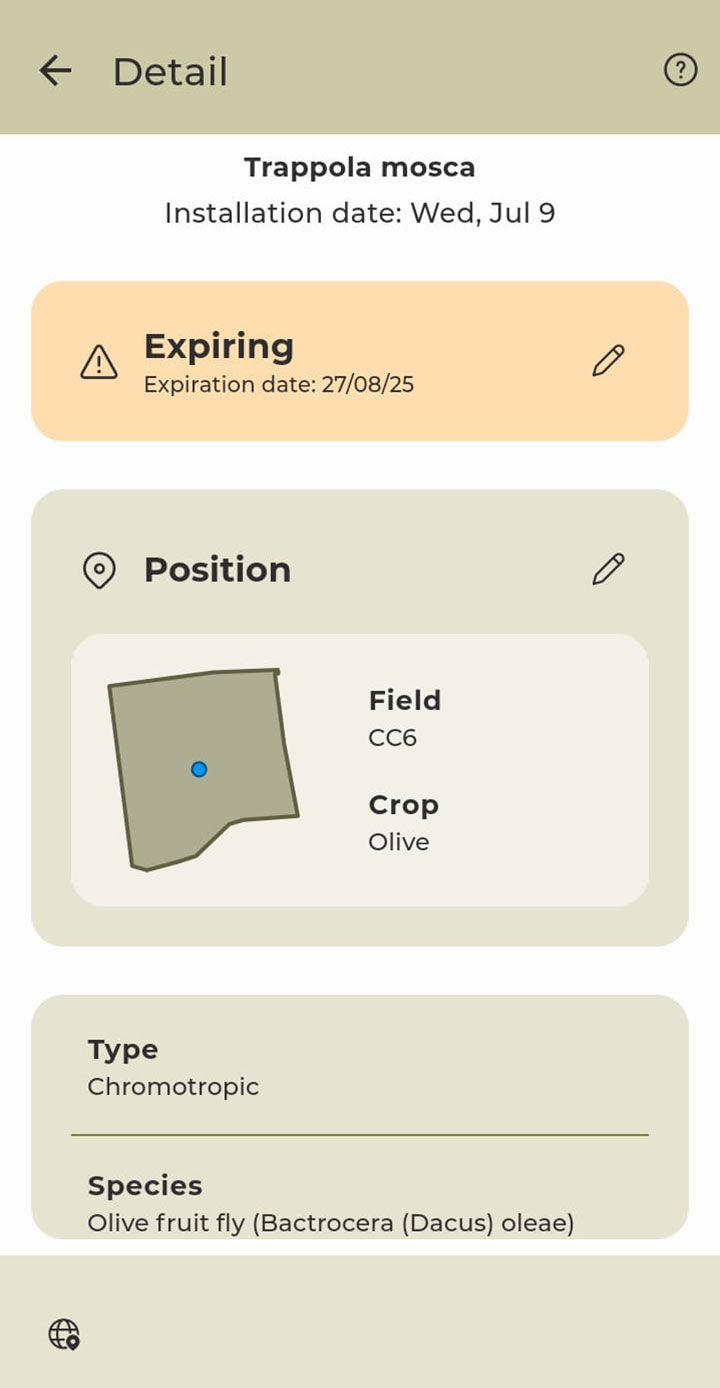
Trap detail
Create a new trap
The process is divided into two steps:
- enter basic information: installation date, field, and location
- enter detailed information
Enter detailed information
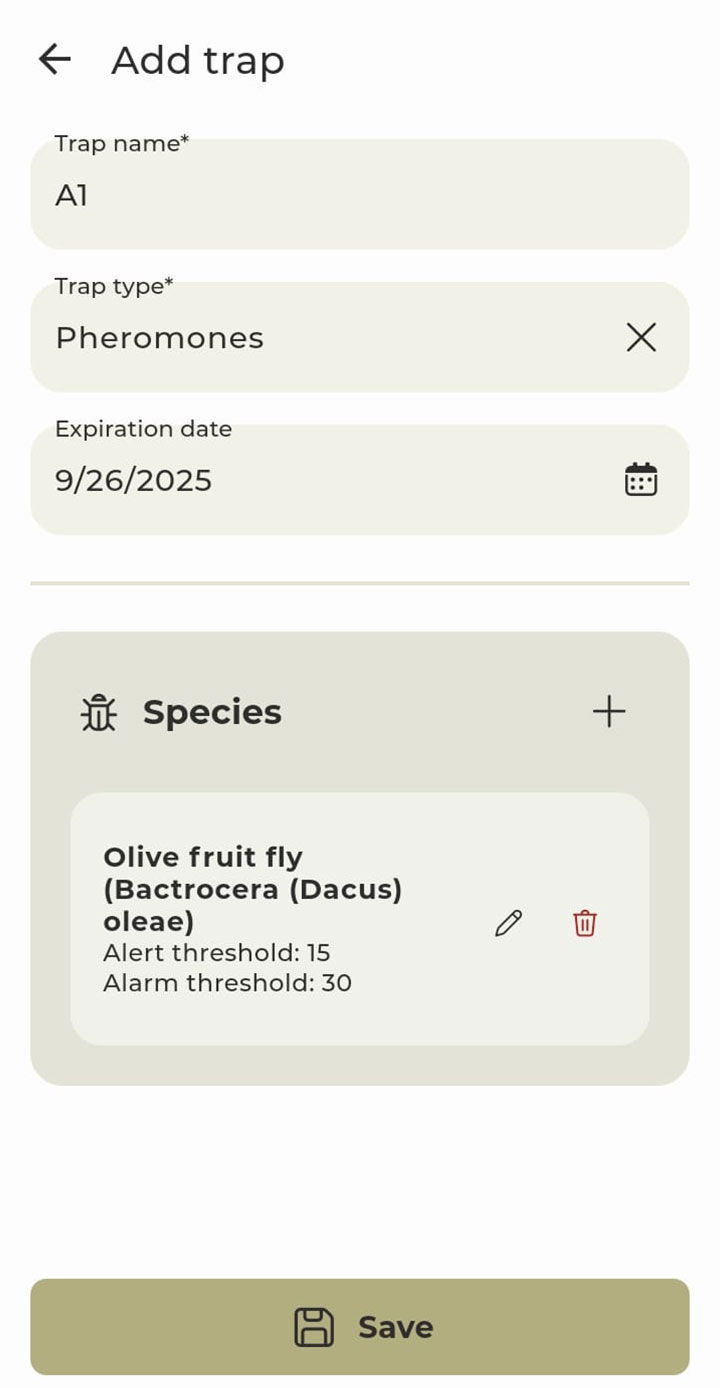
After adding the basic data, by clicking “Next” you access the screen to enter the trap’s detailed information, where you can specify:
- trap name
- trap type
- expiration date (only if the selected type is pheromone)
- target species and related alert thresholds (the selectable species vary depending on the crop in the field)
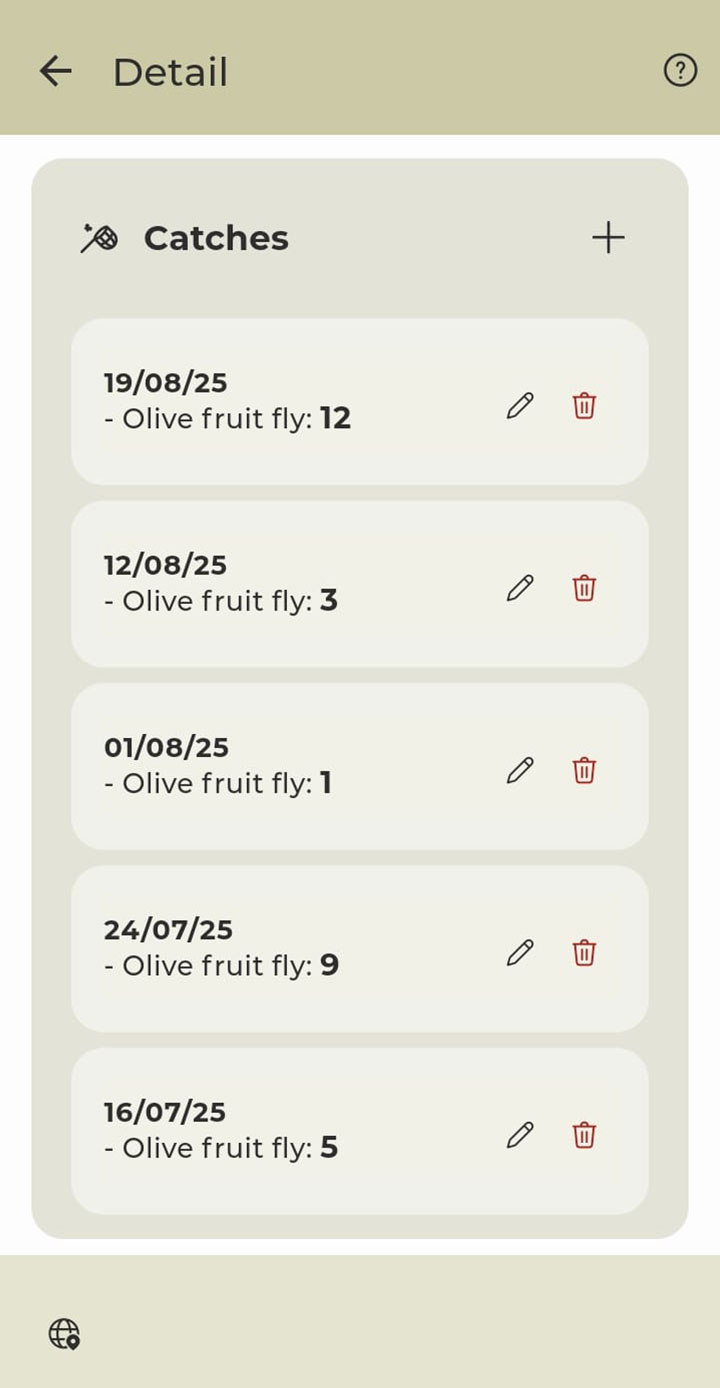
Enter a new catch
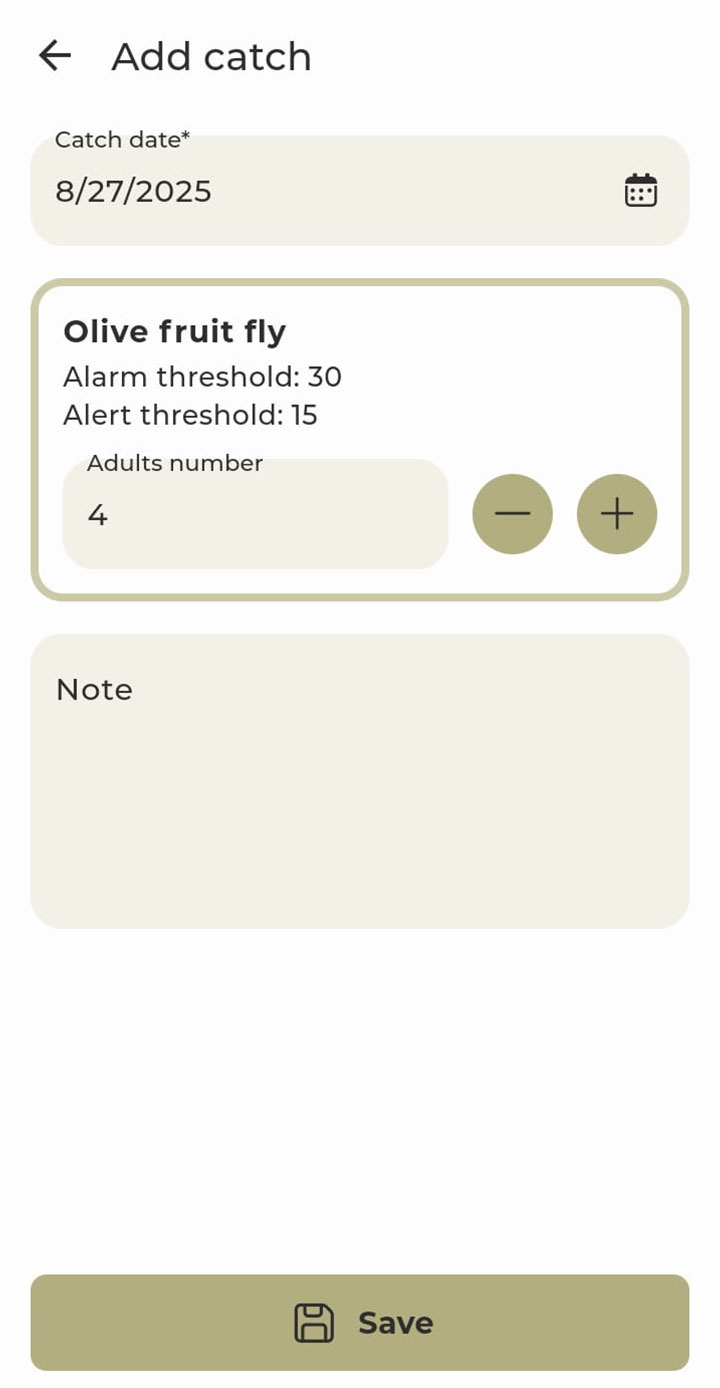
The data you can register include:
- catch date
- number of adults caught for each target species associated with the trap
- additional notes, useful for registering any observations or data collected during monitoring
Vine quality estimation
App mobile
This feature allows you to easily and accurately register qualitative surveys. You can choose between two monitoring modes:
- by point: each sample is registered along with the exact location where it was taken;
- by field: groups together all samples from a field and processes the data starting from the point samples, generating a summary report.
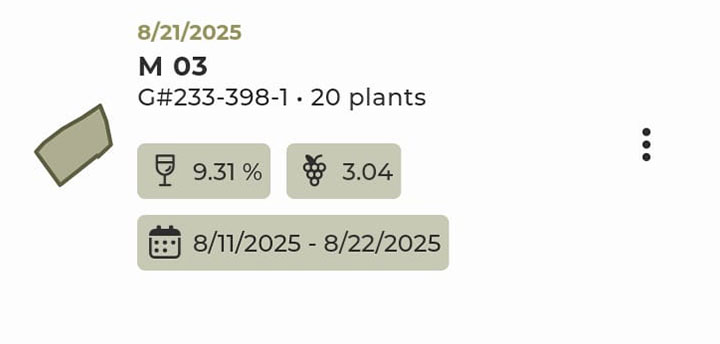
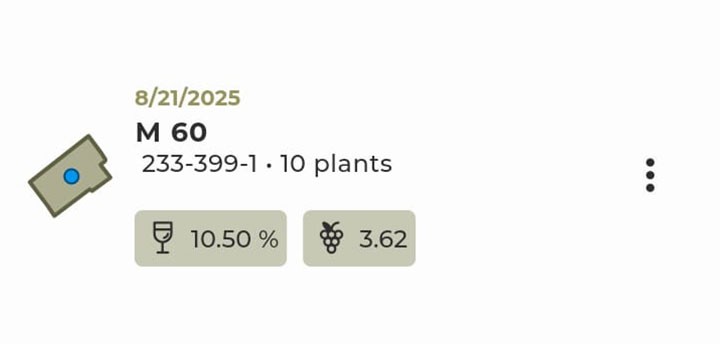
Each sample is displayed as a card containing:
- a graphic representation of the field on the map, with the exact monitoring location (only in the "By point" section)
- sample ID
- number of plants
- sampling date
- field
- "new" tag for samples created within the last 24 hours
- potential alcohol (wine glass icon)
- ripening index (grape cluster icon)
- sampling range (only in the "By field" section)
By field monitoring card
By point monitoring card
Create a new sample
BY POINT
The creation process is divided into 2 steps:
- enter basic information: sampling date, field, and location
- enter the specific data of the sample
BY FIELD
Field monitoring provides an aggregated overview of the individual point samples related to a specific field. The whole process takes place in a single step. After entering:
- sampling date
- field
- sample ID
you can select a time interval. Based on the chosen dates, the available point samples will be loaded and used to automatically pre-fill the specific data of the field sample.
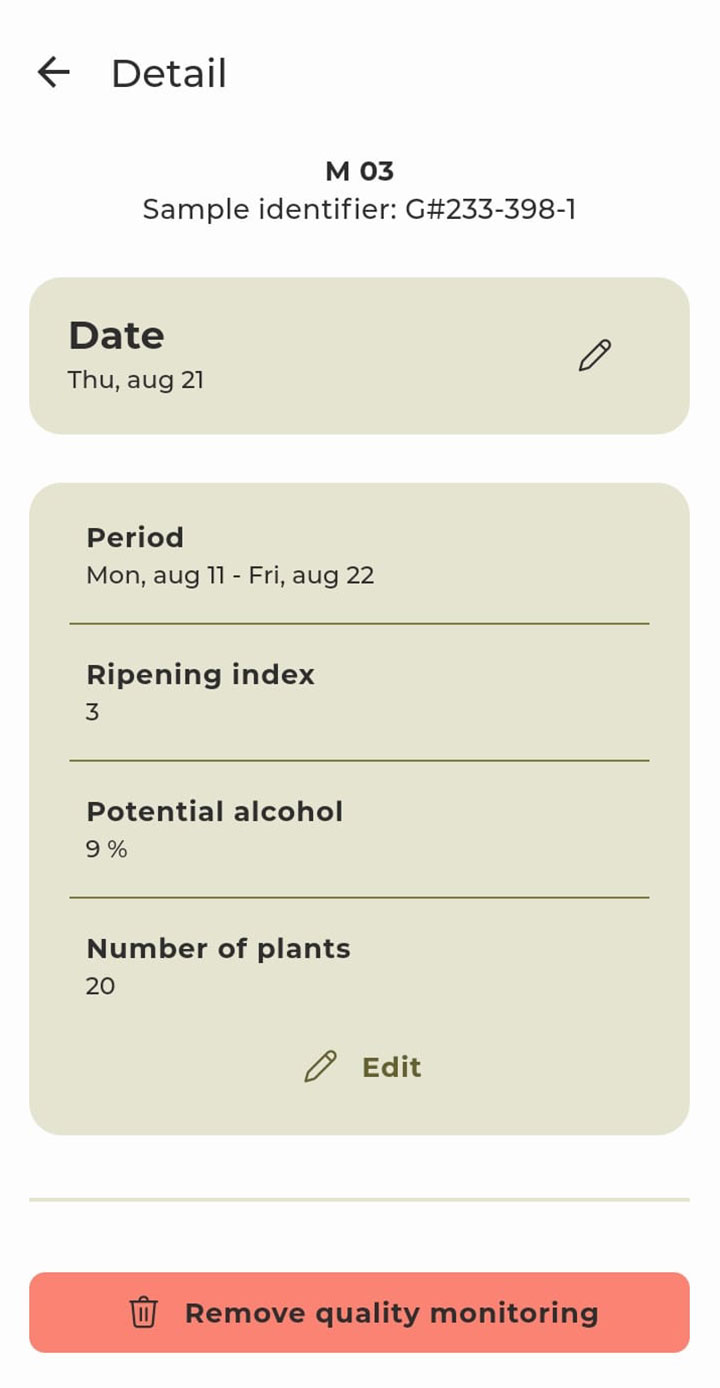
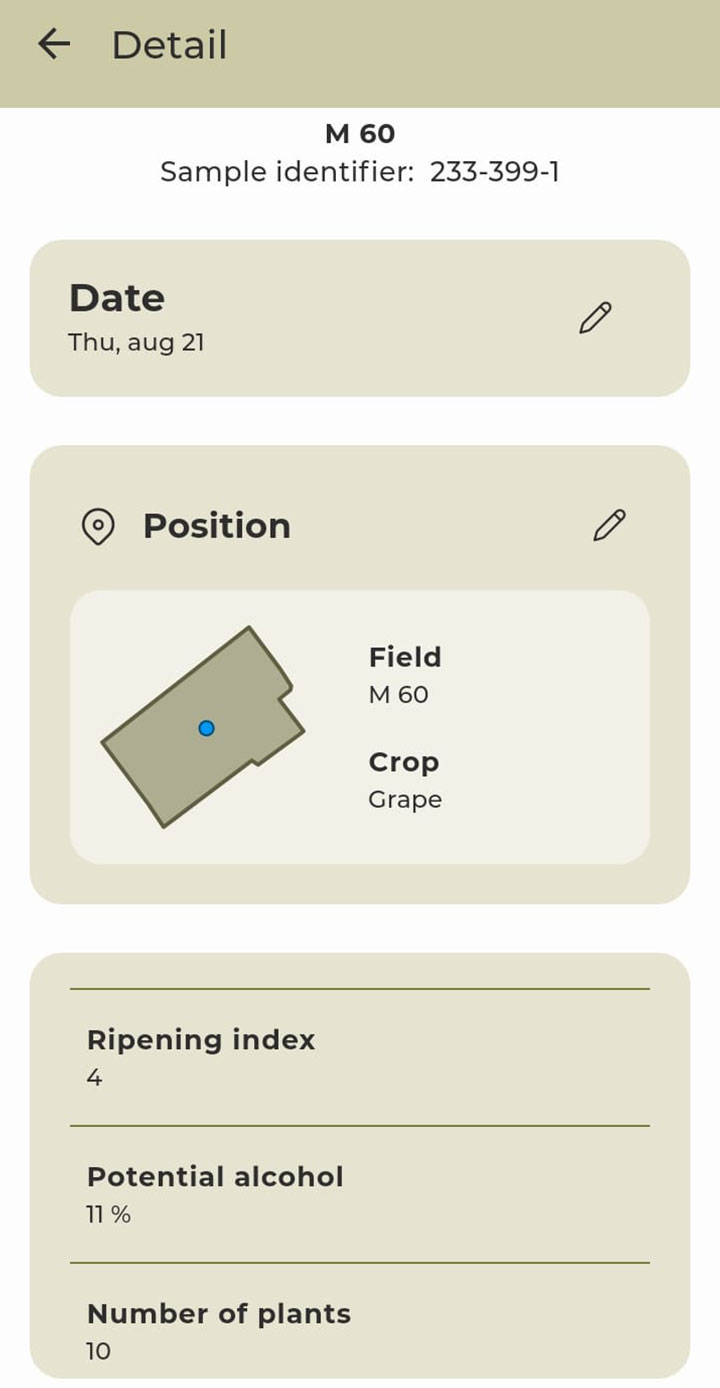
Sample details
By selecting a sample, its detail screen opens, allowing you to view and manage all related information. The detail screen includes:
- field name
- sample ID
- date (editable)
- location (editable; only visible for “by point” samples)
- specific sample data – grouped in a card, including:
- period (only for “by field” samples)
- ripening index
- potential alcohol
- number of plants
Sampling details per field
Sampling details per point
Vine Quantity Estimation
App mobile
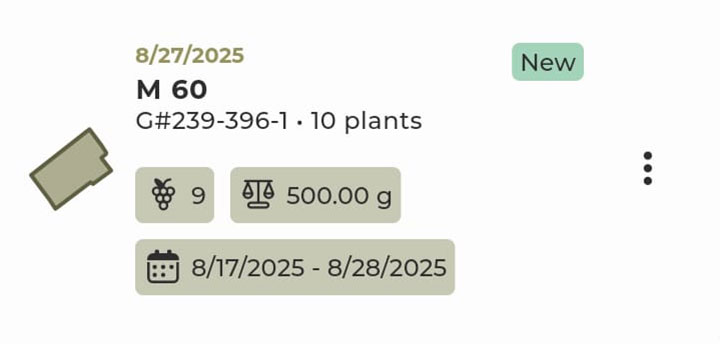
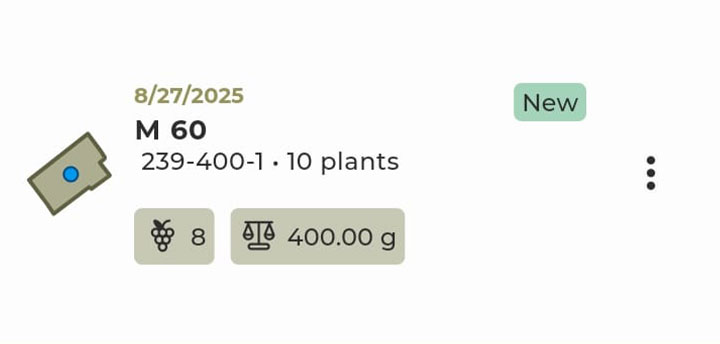
This feature allows you to register quantitative samples. For details on monitoring modes, see the description above in "Vine quality estimation." Each sample is displayed as a card containing:
- a graphic representation of the field on the map, with the exact monitoring location (only in the "By point" section)
- sample ID
- number of plants
- sampling date
- field
- "new" tag for samples created within the last 24 hours
- potential alcohol (scale icon)
- bunch weight (bunch cluster icon)
- sampling range (only in the "By field" section)
By field monitoring card
By point monitoring card
Create a new sample
See the description above in “Vine quantity estimation.”
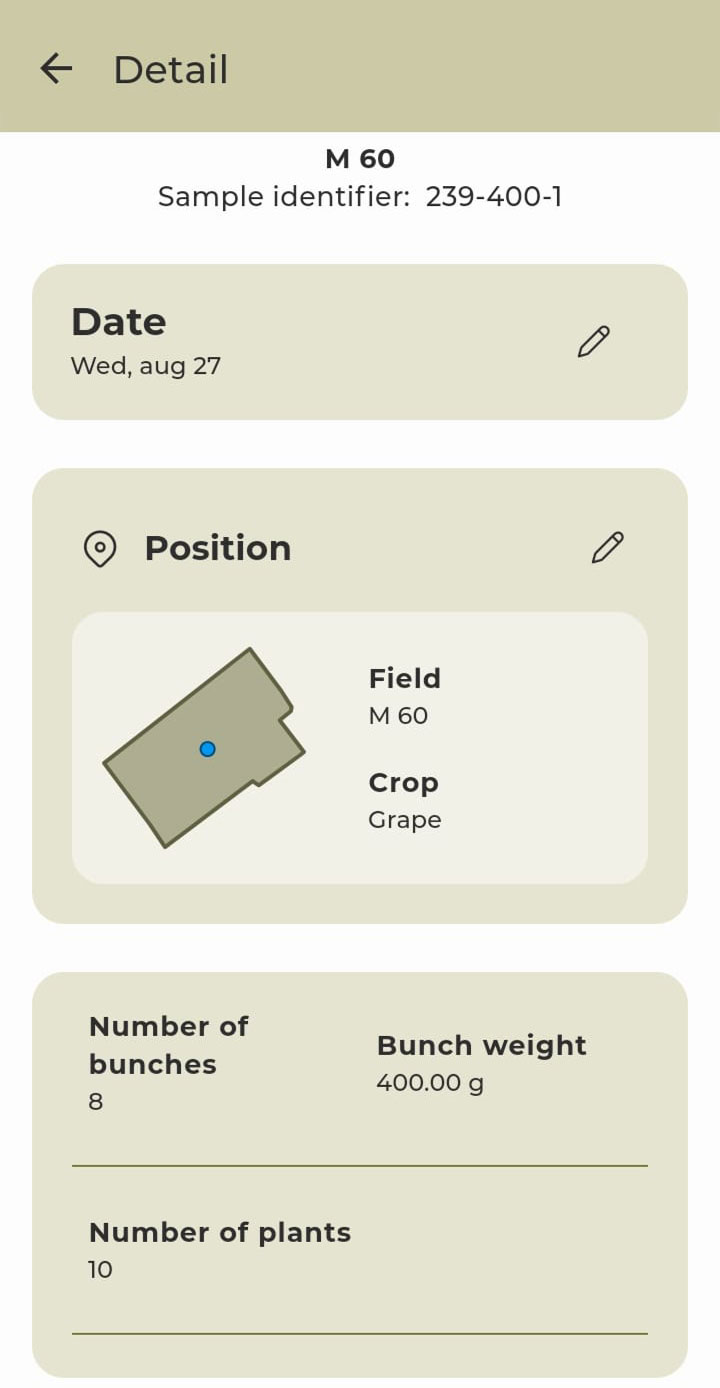
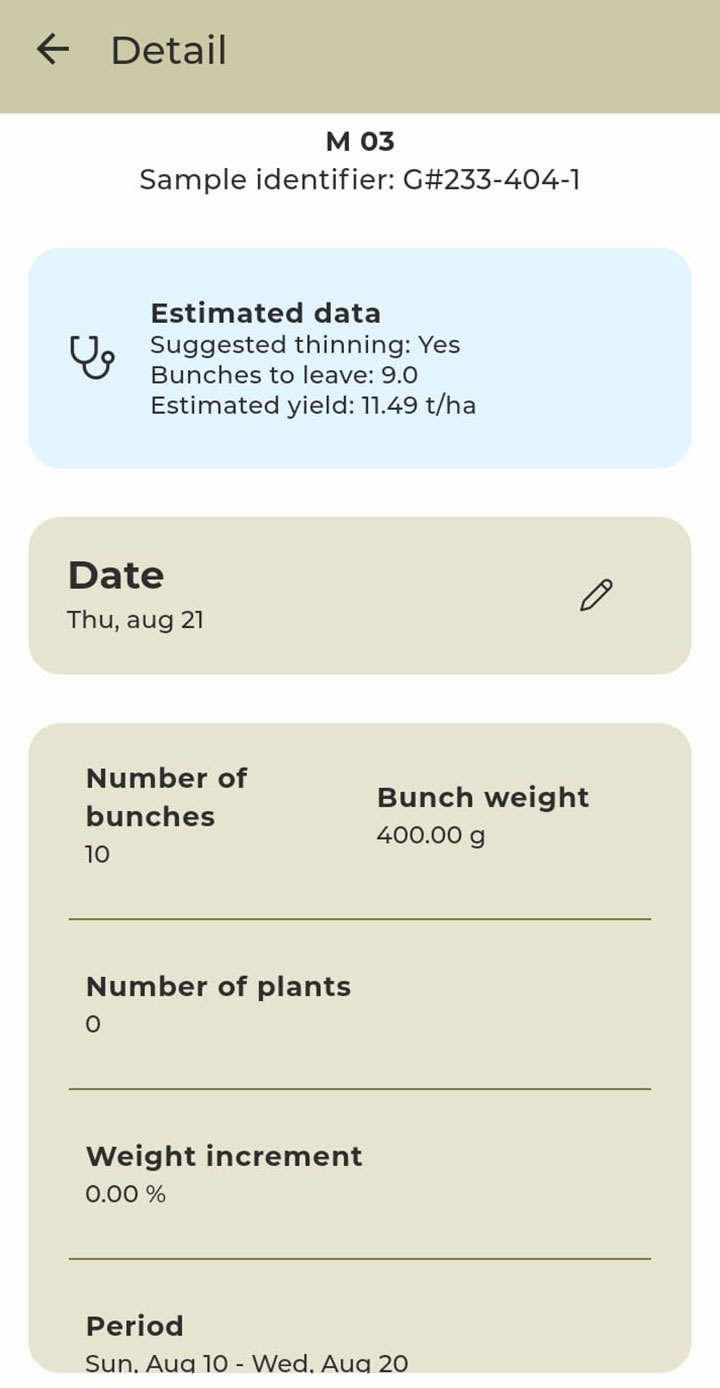
Sample Details
In the detail screen you can find:
- field name
- sample ID
- “estimated data” tab (displayed only if the following values have been entered for the field: inter-row spacing, intra-row spacing, and expected average yield – and only for field monitoring). This tab shows:
- recommended thinning
- number of bunches to leave
- estimated yield
- date (editable)
- location (editable; visible only for “by point” samples)
- Specific sample data – grouped in a card, including:
- period (only for “by field” samples)
- number of bunches
- bunch weight
- weight increase
- number of plants
Sampling details per field
Sampling details per point