The discovery of the Rosetta stone was a great day for Egyptology: a group of almost incomprehensible symbols became a language. The BBCH-scale (acronym for Biologische Bundesanstalt, Bundessortenamt and CHemical industry) represents the equivalent of the Rosetta stone for botanical phenology: we could define it, in fact, as an effective universal coding system for plant development.
What is phenology?
To understand what the BBCH-scale is, we must first understand what phenology is. In biology we talk about phenology to define and classify the events and stages of the development of organisms, in particular plants and insects.
Let’s take an example: when we say “cherry trees are blossoming”, “that’s a beetle larva” or “oaks are losing their leaves” we are describing a phenological phase of a particular organism.
That’s ok, so why the need to have a coding? Botanists refer to the stages of development of plants with more than 50 different definitions by species and often from one plant to another these definitions are not comparable, because the way they develop differs.
It may make sense to speak of “hardening of the stone” in an olive tree but we cannot speak of the same phase in the apple tree. You can talk about “sprouting” in wheat but it would make no sense to talk about it for an almond tree!
The BBCH phenological scale
The BCCH-scale has standardized and homologated everything in a two-number system, from 00 to 99, where the first number indicates the primary stage of development and the second indicates the secondary one. By using this method it has been possible to codify analogous phenologies both for species that had already existing and different scales, and for species in which special scales have never existed.

Diagram of BBCH-scale
Let’s take another example. Looking at the diagram of the BBCH-scale, if we talk about stage 75, regardless of which species we are dealing with, we know that we are talking about the stage ‘fruit development’, the first number tells us: 7. The second number, however, goes into detail and indicates the level of development of the fruit. For the vine ‘75’ is interpreted as “berries have the size of a pea, the bunches begin to touch”. In wheat ’75’ is described as “half milk ripening, caryopsis that have reached their final size but are still green”.
Obviously having the same description in fruits so different from each other is neither possible nor useful, but the stage of development is similar and comparable. We could almost say that in both cases the plant is dedicating itself to the same function.
Characteristics of the BBCH-scale
Let’s now go deeper into the characteristics of the BBCH-scale, which you need to know in order not to run into errors and misunderstandings.
It is important to understand that we are talking about a categorized scale. This means that the 75 mentioned above is a code, not a number, that is 75 is not double 37.5! To get to phase 80, the plant does not take twice as long to get to phase 40 because this scale is not even linear in time.
Another important feature is that the values are not ordinal. This means that there is no order, 20 is no more than 10 and it can happen (indeed, it happens!) that, after or during the emergence of the inflorescences – phase 50- we find phase 30 of elongation of the shoots or phase 18 of formation of the eighth leaf.
BBCH-scale and forecast models
Now that we have understood what it is and how it should be read, let’s go on to see how it is calculated in the forecast models of phenology, and how users can interact with it. It should be noted that it is not a real calculation, since the BBCH value is not a number but a category.
The model uses an algorithm for assigning the BBCH value based on environmental parameters recorded by the weather station; based on this algorithm, we will have an accurate forecast of the phenological phase. At each interaction by the user, the model corrects the output, if necessary, to align it with the observation recorded in the field.

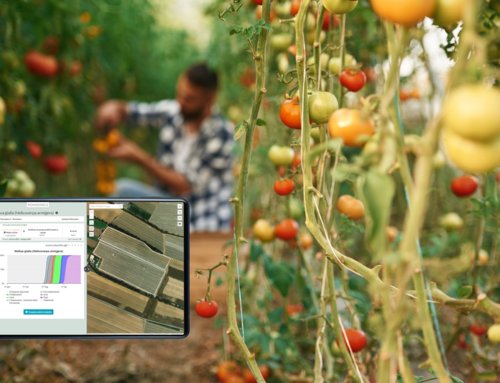
Forecast model of phenology in Agricolus
The phenology model is one of the basic models: it has a strategic importance because many others are based on it. We could not have a model for Peronospora, if we did not know when the vine produces leaves and shoots, just as we could not know the water needs of corn without knowing if at that time the plant is a small bud or in full bloom.